Developing a Tool to Assess Vulnerabilities Downstream of Dams
The combination of structural vulnerabilites increasing with age and increasing likelihood of extreme precipitation puts entities downstream of dams at potential risk of flooding. These downstream entities are part of social, ecological, and technological systems (SETS) (Figure 1). Here at the Flint lab, we are developing a methodological approach and dashboard tool to better visualize the potential impacts dam failures on downstream populations, ecosystems, and critical infrastructure. Utah, similar to other states in the
US, have a large quantity of dams, many of which are getting old and high risk (Figure 2)
This research is part of a larger NSF-funded, interdisciplinary project called the Institute for Geospatial Understanding through an Integrative Discovery Environment (I-GUIDE). I-GUIDE seeks to enable transformative discovery and innovation for tackling fundamental scientific and societal challenges that are at the cusp of achieving significant breakthroughs by harnessing the vast, diverse, and ever-growing corpus of geospatial data (https://i-guide.io/).
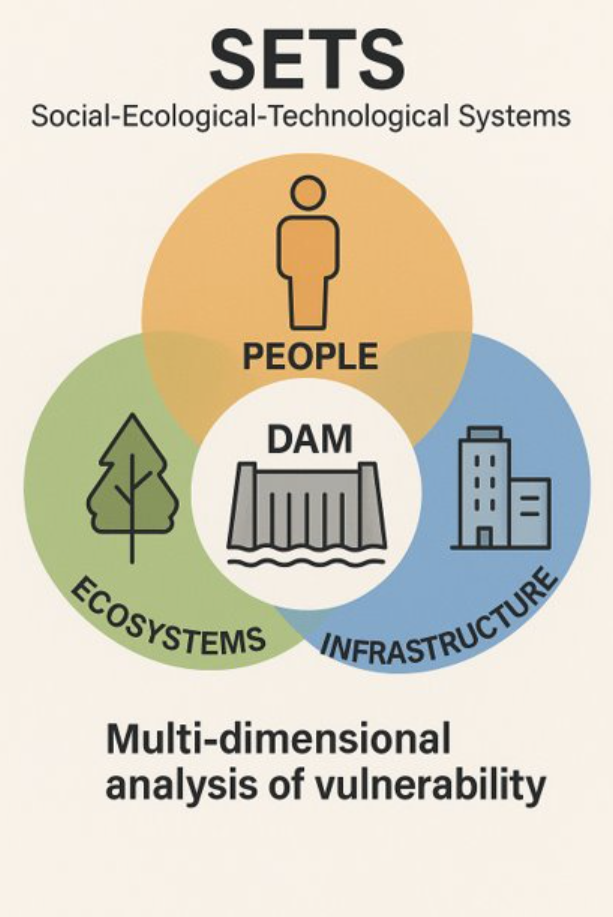
Figure 1. SETS Diagram
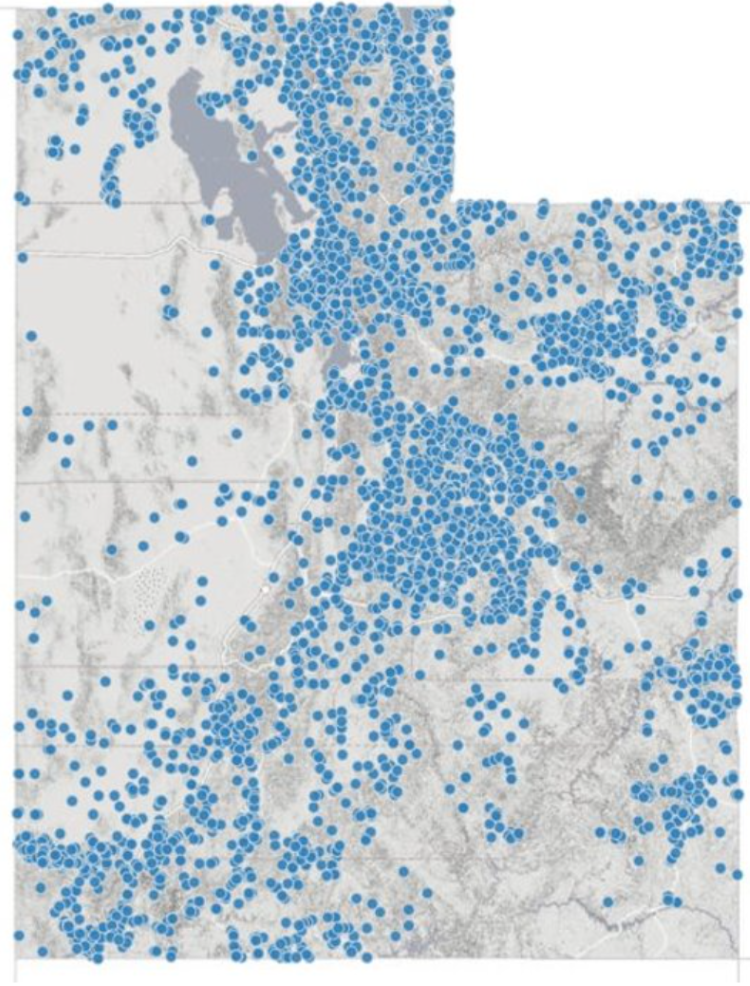
Figure 2. Dams in Utah
In our prototype project, inundation zones for Utah's 234 high-risk, state-regulated dams were collected and projected into ArcGIS Pro (Figure 3). These inundation zones have been geoprocessed in ESRI's ArcGIS Pro and integrated with national, publicly available vulnerable entity datasets to determine vulnerable entities downstream. Data processing via R supports development of a matrix-based visualization that highlights vulnerable entities and their attributes.

Figure 3. State of Utah Regulated, High-Risk Dams
Within social systems we have estimated population, population density, social vulnerability index (SVI), and rural-urban commuting codes (RUCA) to highlight the rural, micropolitan, or metropolitan contexts. Within ecological vulnerabilities, using USGS GAP Data, we have identified protected ecosystems of status 1 and 2. Within technological systems we have identified aviation facilities, power plants, waste water treatment plants, hospitals, major roads (interstates, federal highways, state highways), railroads, natural gas pipelines, and power transmission lines.

Figure 4. Vulnerability Matrix
Visualizing downstream risks using a matrix approach allows for quick comparison across the state's dams. We have also developed matrices for dam attributes, land cover in inundation zones, and the potential for extreme precipitation based on climate modeling. We are also working with our interdisciplinary I-GUIDE team to develop a geodatabase and web-based dashboard that will incorporate the processes to enable application of these tools for any set of dams across the United States.